Symbols in Data Flow Diagram: System Interactions!
In Data Flow Diagrams (DFDs), symbols are vital for analyzing system interactions.
- Processes, represented by rectangles or squares, highlight operations within the system.
- Data Stores, depicted as open-ended rectangles, store and interact with data, ensuring integrity.
- External Entities, shown as rectangles, define system boundaries and interact outside these boundaries.
- Data Flows, illustrated by arrows, demonstrate the direction of data movement.
- Control Flows distinguish logic and operational sequences. Junctions indicate critical decision points.
Understanding these symbols simplifies complex system analyses, enhancing your grasp of how data moves and is processed. Exploring further will reveal deeper insights into efficiently designing and analyzing systems.
Key Takeaways
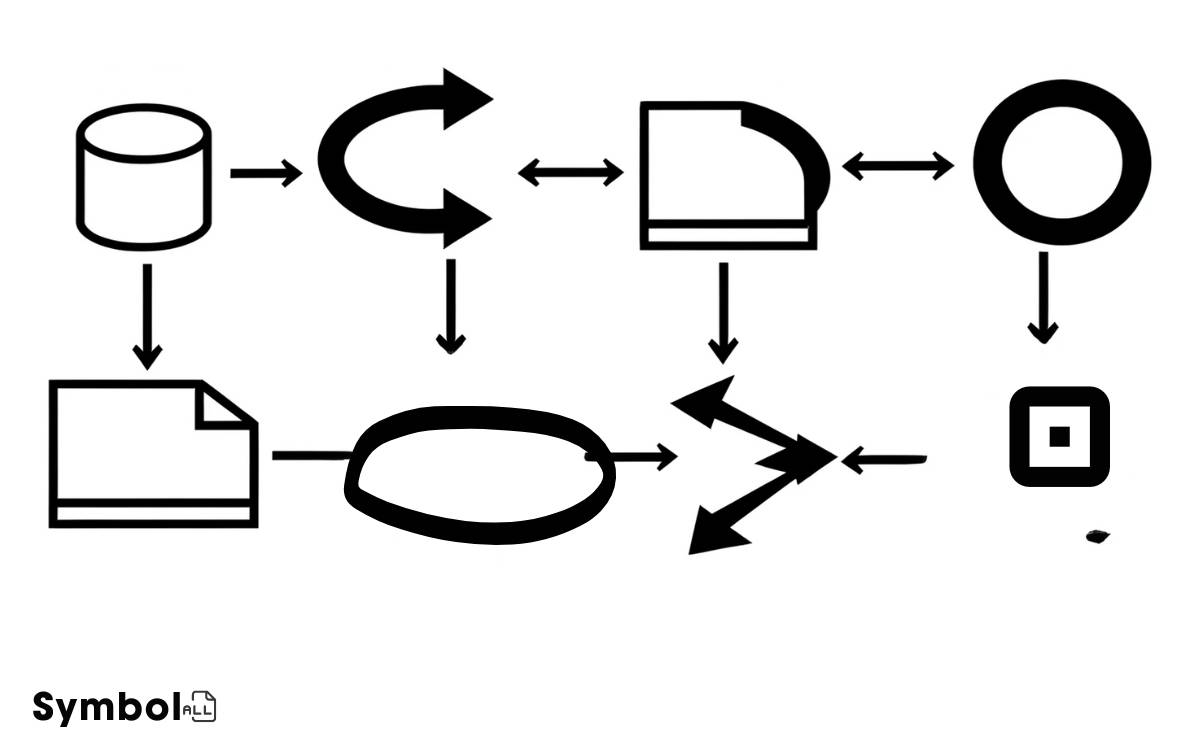
4 Data Flow Diagram Symbols and Meanings
| Symbol | Name | Purpose |
|---|---|---|
| ○ | External Entity | Represents sources or destinations of data outside the system. |
| □ | Process | Shows how incoming data is processed to produce outgoing data. |
| → | Data Flow | Illustrates the flow of data between entities, processes, and data stores. |
| ┴ | Data Store | Indicates a place where data is stored within the system. |
Understanding Processes
In the domain of data flow diagrams, understanding processes is vital, as they serve as the operational core that transforms incoming data into the desired output.
You must grasp how these processes function within the diagram to accurately interpret or construct meaningful representations of data handling.
Each process symbolizes a specific operation be it calculations, data modification, or decision-making activities. These are depicted as circles or ovals, labeled with a descriptive name to clarify their purpose.
It’s essential to recognize that processes are interconnected; they receive input from and send output to other components within the diagram. This interplay is what allows for the dynamic modeling of how data moves and changes throughout a system.
Understanding these processes gives you insight into the operational flow and helps identify potential efficiencies or bottlenecks.
The Essence of Data Stores
After understanding processes, it’s imperative you grasp the role of data stores, which act as repositories holding data at rest for retrieval and use by various system processes.

In Data Flow Diagrams (DFDs), data stores are pivotal, symbolizing where data is stored within the system. They’re not just static entities; they interact dynamically with processes to provide necessary information or to store output data.
Recognizing data stores helps in identifying how data persists across system operations, ensuring data integrity and accessibility.
When analyzing or designing systems, you’ll often delineate between different types of data stores, such as databases or files, based on their usage and the nature of data they hold.
Understanding their placement and function within DFDs allows for a clearer insight into system workflows, facilitating more effective system analysis and design.
External Entities Explained
You’ll first need to recognize external entities as key components that interact outside the system’s boundary.

Understanding their interactions with processes is important for mapping data flows accurately.
Identifying External Entities
To fully understand data flow diagrams, it’s important to first grasp what external entities are and how they interact with the system. Identifying these entities is vital for accurately mapping out a system’s data flows.
External entities, often depicted as squares or rectangles in diagrams, represent sources or destinations of data outside the system’s boundaries.
To identify them effectively:
- Look for any system, process, or actor that provides or receives data from your system but doesn’t belong within its process flows.
- Consider entities that initiate or are the final recipients of data flows.
- Pay attention to external systems and interfaces that interact with your system, providing inputs or receiving outputs.
Understanding these entities allows for a clearer representation of how external factors influence system operations, without delving into the specifics of interactions.
Interaction With Processes
Understanding an external entity’s interaction with processes is essential for mapping the system’s data flows accurately. When you explore data flow diagrams (DFDs), you’ll notice external entities are pivotal.
They represent sources or destinations of data outside the system boundary. Your analysis must clarify how these entities interact with system processes.
This involves identifying the data exchanged between external entities and processes, which is important for defining system boundaries and understanding system interactions with its environment.
External entities can be anything from users inputting data, to other systems providing data feeds. Each interaction should be mapped to specific processes within your DFD, highlighting data inputs and outputs. This meticulous mapping guarantees thorough system analysis, facilitating better design and implementation.
Representation and Notation
Having explored how external entities interact with processes, let’s now examine how they’re represented and the notation used in data flow diagrams.
External entities are vital for understanding system boundaries and interactions. They’re depicted using specific symbols and notations to guarantee clarity and universality across diagrams.
Here are key points about their representation:
- Rectangles are typically used to symbolize external entities, clearly distinguishing them from processes.
- Labels are essential; each rectangle must be named to identify the external entity it represents.
- Arrows show the flow of data between entities and processes, indicating direction and nature of interaction.
This concise approach to notation ensures that anyone reviewing a data flow diagram can immediately understand the external entities’ roles and how they integrate with the system’s processes.
Deciphering Data Flows
Decoding data flows is essential for accurately interpreting the interactions between different elements within a system. When you’re examining a Data Flow Diagram (DFD), you’re looking at how data moves from one process or entity to another.

Each flow represents the transfer of information, not the physical movement of material. It’s important to understand that these flows are depicted by arrows, with the direction indicating the flow of information.
To effectively decipher these flows, you’ll need to pay close attention to the symbols: processes are represented by circles or rectangles, external entities by squares or rectangles, and data stores by open-ended rectangles.
By analyzing how these arrows connect various symbols, you gain insights into the operational processes, identifying potential bottlenecks or inefficiencies within the system.
The Role of Control Flows
In a Data Flow Diagram (DFD), control flows are critical as they dictate the logic that governs the data movement between processes and data stores. Understanding their role is pivotal for accurately modeling an information system.

Here are key points to grasp:
- Control flows represent conditions or rules that must be met before data can proceed from one point to another.
- They’re symbolized uniquely, distinguishing them from data flows, to avoid confusion and enhance clarity in the diagram.
- Their precise depiction helps in identifying the sequence of operations, ensuring the system’s functionality aligns with the intended design.
Interpreting Junctions
Junctions in a Data Flow Diagram (DFD) serve as critical points where data paths converge or diverge, necessitating your careful interpretation to understand the system’s data processing logic.
These junctions aren’t just arbitrary; they represent decision points, data merging, or splitting scenarios that are pivotal in the system’s operation.
When you’re examining a DFD, it’s crucial to scrutinize these junctions to grasp how data is manipulated or assessed throughout the system.
Think of junctions as the system’s logic nodes where inputs are taken, conditions are evaluated, and then directed towards the appropriate path based on those conditions.
Understanding their role and placement within the DFD allows you to piece together the overall data flow, making the diagram not just a collection of symbols, but a coherent map of the process logic.
Symbols for Predefined Processes
You’ll find that predefined processes in Data Flow Diagrams (DFDs) are pivotal for streamlining complex operations. They’re represented by specific symbols, each carrying distinct meanings essential for your interpretation.

Understanding these symbols and their implications allows for a more accurate depiction of system functions.
Understanding Predefined Processes
Predefined process symbols streamline the representation of complex operations in data flow diagrams, allowing you to grasp system functions quickly. These symbols are essential for you to understand how data moves and transforms within the system.
Here are key points to remember:
- Predefined processes are depicted with specific shapes, often rectangles with double vertical lines, signifying a series of operations that have been previously defined.
- They enable you to reduce clutter in your diagrams by encapsulating complex processes into a single, understandable symbol.
- Utilizing these symbols effectively requires a clear definition of the process boundaries and inputs/outputs to make sure that the diagram remains accurate and informative.
Understanding these symbols is vital for analyzing and communicating the intricacies of system data flows.
Common Symbols Used
To effectively map out system processes, it’s important to familiarize yourself with the common symbols used for predefined processes in data flow diagrams. These symbols serve as the visual language for illustrating the flow of data and operations within a system.
A rectangle or square often represents a process, showing a transformation or manipulation of data. Data flows are depicted using arrows, indicating the direction of data movement between processes or data stores.
Circles or ovals symbolize the start or end points, also known as terminators, highlighting the boundaries of the system. Data stores are represented by open-ended rectangles, indicating where data rests within the system.
Understanding these symbols is essential for accurately mapping and analyzing system processes, ensuring clarity and efficiency in design and documentation.
Interpreting Symbol Meanings
Understanding the common symbols used in data flow diagrams paves the way for interpreting the specific meanings of symbols for predefined processes.
Predefined processes in data flow diagrams (DFDs) are important because they represent operations where the process details aren’t shown.
Here’s what you need to know:
- Rectangles with double vertical edges signify predefined processes. This symbol indicates a set of operations encapsulated within a module, often detailed elsewhere.
- Usage: It simplifies complex diagrams by hiding the underlying details of a process, making the DFD easier to read.
- Interpretation: When you encounter this symbol, it’s a cue to refer to the documentation or another diagram for the detailed workings of this process.
Analyzing these symbols accurately is essential for understanding the overall system architecture and data flow.
Distinguishing Terminator Symbols
In data flow diagrams, terminators, often external entities or actors, play a significant role in delineating the system’s boundaries. You’ll identify these terminators by their distinct symbol: usually a rectangle labeled with the entity’s name.

It’s important to distinguish them accurately because they mark where data enters or exits the system, highlighting interaction points with external systems or users.
Understanding terminators isn’t just about recognizing their shape; it’s about comprehending their function. They aren’t mere placeholders. Each terminator symbolizes a source or destination of data, basically framing the system’s scope.
By clearly identifying these symbols, you make sure that your data flow diagram accurately represents the system’s interactions with its environment.
This precision is crucial for effective analysis and design, facilitating a deeper understanding of system boundaries and data exchanges.
Conclusion
To sum up, haven’t you found that the symbols in data flow diagrams are more than mere markings? They’re the language through which complex processes, data stores, and external entities communicate.
Understanding each symbol, from the intricate pathways of data flows to the decisive nature of control flows and junctions, elevates your analytical skills. Recognizing predefined processes and terminator symbols further sharpens your precision.
Mastering these symbols is crucial for dissecting and constructing effective data flow diagrams.


