What Symbol Represents Sample Standard Deviation in Statistics?
The symbol for sample standard deviation is denoted as 's'. This statistic measures the dispersion of individual data points from the mean within a sample dataset.
It is calculated as the square root of the sample variance, which provides an essential understanding of data variability. Accurate assessment of sample standard deviation is crucial for making informed decisions and comparing dataset consistency.
Differing from population standard deviation (σ), sample standard deviation applies a correction factor (n-1) to adjust for bias in smaller samples. Understanding this concept can greatly enhance the interpretation of statistical data, leading to deeper insights.

Key Takeaways
- The symbol for sample standard deviation is denoted as 's'.
- Sample standard deviation quantifies the dispersion of data points from the sample mean.
- 's' is used to distinguish sample standard deviation from population standard deviation, which uses 'σ'.
- Sample standard deviation is crucial in evaluating data consistency and variability within a sample.
- It is calculated by taking the square root of the sample variance.
Definition of Sample Standard Deviation
The sample standard deviation is a measure of the dispersion or spread of a set of values in a sample dataset. It quantifies the extent to which individual data points deviate from the sample mean.
Mathematically, it is the square root of the variance, which is the average of the squared differences between each data point and the mean. Symbolically, the sample standard deviation is denoted by 's.'
This statistic is essential for understanding the variability within a sample, as opposed to the population standard deviation, which applies to an entire population.
The formula for calculating the sample standard deviation includes adjustments for the sample size, ensuring an unbiased estimate of the population standard deviation when the sample data is random.
Importance in Statistics
The sample standard deviation is an important metric in statistics as it quantifies the variability or dispersion within a dataset.
By providing insight into the spread of data points, it enhances the interpretation of data, enabling more informed decision-making and analysis.
This measure is instrumental in comparing the consistency and reliability of different datasets.
Measuring Data Variability
Evaluating data variability is important in statistics as it provides insights into the dispersion and reliability of data points within a dataset. Understanding variability helps statisticians and researchers assess the consistency of their data, identify outliers, and make informed decisions. Key measures of variability include the range, variance, and standard deviation. These metrics offer different perspectives on how data points spread around the mean, contributing to a thorough analysis.
| Measure | Definition | Symbol |
|---|---|---|
| Range | Difference between the maximum and minimum values | \( R \) |
| Variance | Average of the squared differences from the mean | \( \sigma^2 \) |
| Standard Deviation | Square root of the variance | \( s \) or \( \sigma \) |
Such measures are fundamental for evaluating the robustness and precision of statistical conclusions.
Enhancing Data Interpretation
Understanding measures of data variability lays the foundation for enhancing data interpretation, which is paramount in deriving meaningful insights from statistical analyses.
Measures such as the sample standard deviation (denoted as \( s \)) provide a quantifiable metric of data dispersion around the mean. This metric enables statisticians to assess the reliability and consistency of data, facilitating more accurate predictions and decisions.
In practical terms, a lower standard deviation indicates data points are closely clustered, suggesting less variability and greater predictability. Conversely, a higher standard deviation signals greater variability and potential outliers.
Calculating Step-by-Step
To calculate the sample standard deviation, begin by determining the mean of the dataset. This initial step provides the foundation for subsequent calculations.
Follow these steps:
- Calculate the mean: Sum all the data points and divide by the number of points.
- Compute the deviations: Subtract the mean from each data point to find the deviation of each point.
- Square the deviations: Square each deviation to eliminate negative values.
- Sum the squared deviations: Add up all the squared deviations.
- Divide and take the square root: Divide the sum by the number of data points minus one, then take the square root of the result.
Formula Breakdown
In the 'Formula Breakdown' section, we will systematically examine the symbol and notation for the sample standard deviation, followed by a detailed, step-by-step calculation process.
This analysis will be complemented by practical examples to illustrate the application of the formula in real-world scenarios.
Each point will be discussed to guarantee a thorough understanding of the concept.
Symbol and Notation Explained
The symbol for the sample standard deviation, typically denoted as 's', represents the square root of the average squared deviations from the mean in a sample. This notation is integral to statistics and helps quantify the variability within a data set.
Understanding 's' requires familiarity with several key components:
- Sample Mean (x̄): The arithmetic average of the sample data.
- Deviation (x – x̄): The difference between each data point and the sample mean.
- Squared Deviations ((x – x̄)²): Each deviation squared to eliminate negative values.
- Sum of Squared Deviations (Σ(x – x̄)²): Total of all squared deviations.
- Sample Size (n): The number of observations in the sample, with (n – 1) used for unbiased estimation.
These elements together clarify the notation and significance of 's'.
Calculation Step-by-Step
Understanding the calculation of the sample standard deviation involves a systematic breakdown of its formula to guarantee precise and meaningful interpretation of data variability. The formula for sample standard deviation (s) is:
\[ s = \sqrt{rac{\sum (x_i – ar{x})^2}{n-1}} \]
This ensures that each step is carefully followed for accuracy:
| Step | Description | Result |
|---|---|---|
| 1 | Calculate the mean (\(ar{x}\)) | \(ar{x} = rac{\sum x_i}{n}\) |
| 2 | Compute squared deviations from the mean | \((x_i – ar{x})^2\) |
| 3 | Sum squared deviations and divide by \(n-1\) | \(rac{\sum (x_i – ar{x})^2}{n-1}\) |
Practical Examples Provided
To solidify understanding of the sample standard deviation calculation, consider the following practical examples that break down each step of the formula.
Suppose we have a sample data set: 5, 7, 3, 8, and 10. Here are the steps:
- Calculate the mean: (5 + 7 + 3 + 8 + 10) / 5 = 33 / 5 = 6.6
- Subtract the mean from each data point: (-1.6, 0.4, -3.6, 1.4, 3.4)
- Square each difference: (2.56, 0.16, 12.96, 1.96, 11.56)
- Sum the squared differences: 2.56 + 0.16 + 12.96 + 1.96 + 11.56 = 29.2
- Divide by (n-1) and take the square root: √(29.2 / 4) = √7.3 ≈ 2.7
This yields a sample standard deviation of approximately 2.7.
Common Misconceptions

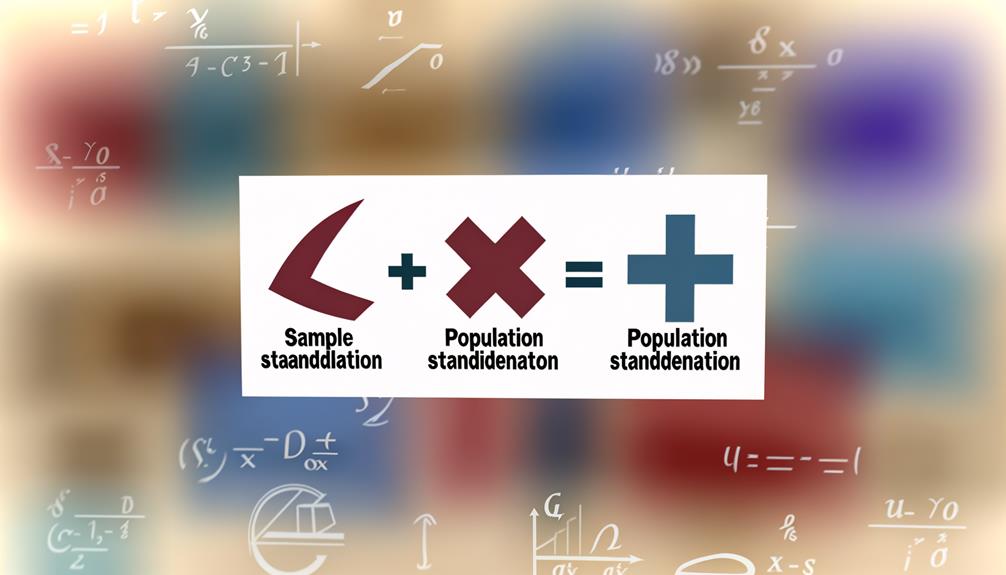
A common misconception is that the symbol for the sample standard deviation is the same as that for the population standard deviation. This confusion often arises due to the similarity in their notations and the related concepts of variance.
The symbol for population standard deviation is represented by the Greek letter sigma (σ), while the sample standard deviation is denoted by the Latin letter 's'. Misinterpreting these symbols can lead to significant errors in statistical analysis, as the calculations for population and sample standard deviations differ due to their respective denominators.
It is important to distinguish between these symbols to guarantee accurate representation and interpretation of statistical data. Understanding this distinction is fundamental to proper statistical practice.
Real-World Applications
Statistical analyses in fields like healthcare, finance, and engineering often depend on the sample standard deviation to make informed decisions based on data variability. The measure is essential for evaluating the dispersion of sample data, which directly impacts decision-making processes.
In healthcare, for instance, it assists in understanding patient response variability to treatments. In finance, it aids in assessing the risk associated with investment portfolios. Engineering uses it for quality control and process stability.
- Healthcare: Evaluates treatment effectiveness and patient outcomes.
- Finance: Analyzes investment risks and portfolio performance.
- Engineering: Guarantees product quality and process reliability.
- Education: Examines test scores and learning outcomes variability.
- Environmental Science: Monitors changes in environmental data.
These applications highlight the practical significance of the sample standard deviation.
Comparing to Population Standard Deviation
When comparing the sample standard deviation to the population standard deviation, it is important to understand that the former estimates the latter when the entire population data is not available.
The sample standard deviation (denoted as \( s \)) is calculated with a denominator of \( n-1 \), where \( n \) is the sample size, to rectify for bias. Conversely, the population standard deviation (denoted as \( \sigma \)) uses \( N \), the population size, as the denominator.
This distinction assures that the sample standard deviation provides an unbiased estimate of the population standard deviation, compensating for the limited data. Consequently, \( s \) typically tends to be slightly larger than \( \sigma \) due to this correction factor.
Tools and Resources
Understanding the distinction between sample and population standard deviations informs the selection of appropriate tools and resources for accurate statistical analysis. For practitioners and researchers, a variety of tools can facilitate the calculation and interpretation of the sample standard deviation.
- Software Packages: R, Python (NumPy, SciPy), and SPSS offer robust functions for statistical calculations.
- Online Calculators: Websites like Calculator.net provide quick and easy computations for sample standard deviation.
- Textbooks: Thorough guides, such as those by authors like Moore and McCabe, offer theoretical and practical insights.
- Academic Journals: Publications in statistical journals often provide advanced methodologies and case studies.
- Workshops and Webinars: Professional development courses offer hands-on experience and expert guidance.
Using these resources guarantees accurate and dependable statistical outcomes.
Conclusion
The sample standard deviation, symbolized as \( s \), is an indispensable cornerstone in the field of statistical analysis. Its significance cannot be overstated, as it provides critical insights into data variability.
Mastery of its calculation and comprehension of its formula are paramount for accurate data interpretation. Misunderstanding this concept could lead to disastrous analytical errors.
The profound difference between sample and population standard deviation further underscores its importance. Utilize advanced tools and resources to harness its full potential.